InBox StatsDashboard
Version 6.1.1
Creation date 2019-07-08
Resources
This module creates three graphs with statistical call data.
Prerequisites
Framework
The following versions of OTRS Framework are supported:
- [6.0.x]
Modules
The following modules are required:
- InBox Core 6.22.7 ou superior
Operating System
The following operating systems are required:
- [None]
Third Party Software
The following third party software is required:
- [None]
Installation
bin/otrs.Console.pl Admin::Package::Install /path/to/InBox\ StatsDashboards 6.1.1.opm
Configuration
This module can be configured via "System Configuration" in the administrative interface. The following configuration options are available:
StatsDashboards::DefaultQueueIDs
The "Burst ANSs" and "Monthly ANSs and Tickets" graphs will consider the queue IDs entered through this setting as they are not stored in user preferences.

StatsDashboards::DefaultUserIDs
The "Closed Tickets" graph will consider user IDs entered through this setting as they are not stored in user preferences.

StatsDashboards::Config###States
The "Open vs. Closed Tickets per Month" chart will consider the state names entered through this setting. Enter state names referring to "open" and "closed" state types. After updating this configuration, you need to run the script as follows: perl StatsDashboardANSMonthsBackEnd.pl

StatsDashboards::Config###Types
The "Open vs. Closed Tickets per Month" chart will consider the type names entered through this setting. After updating this configuration, you need to run the script as follows: perl StatsDashboardANSMonthsBackEnd.pl

Usability
Using the module
After installing the module you can access the graphics from the top menu of the screen called Indicators:
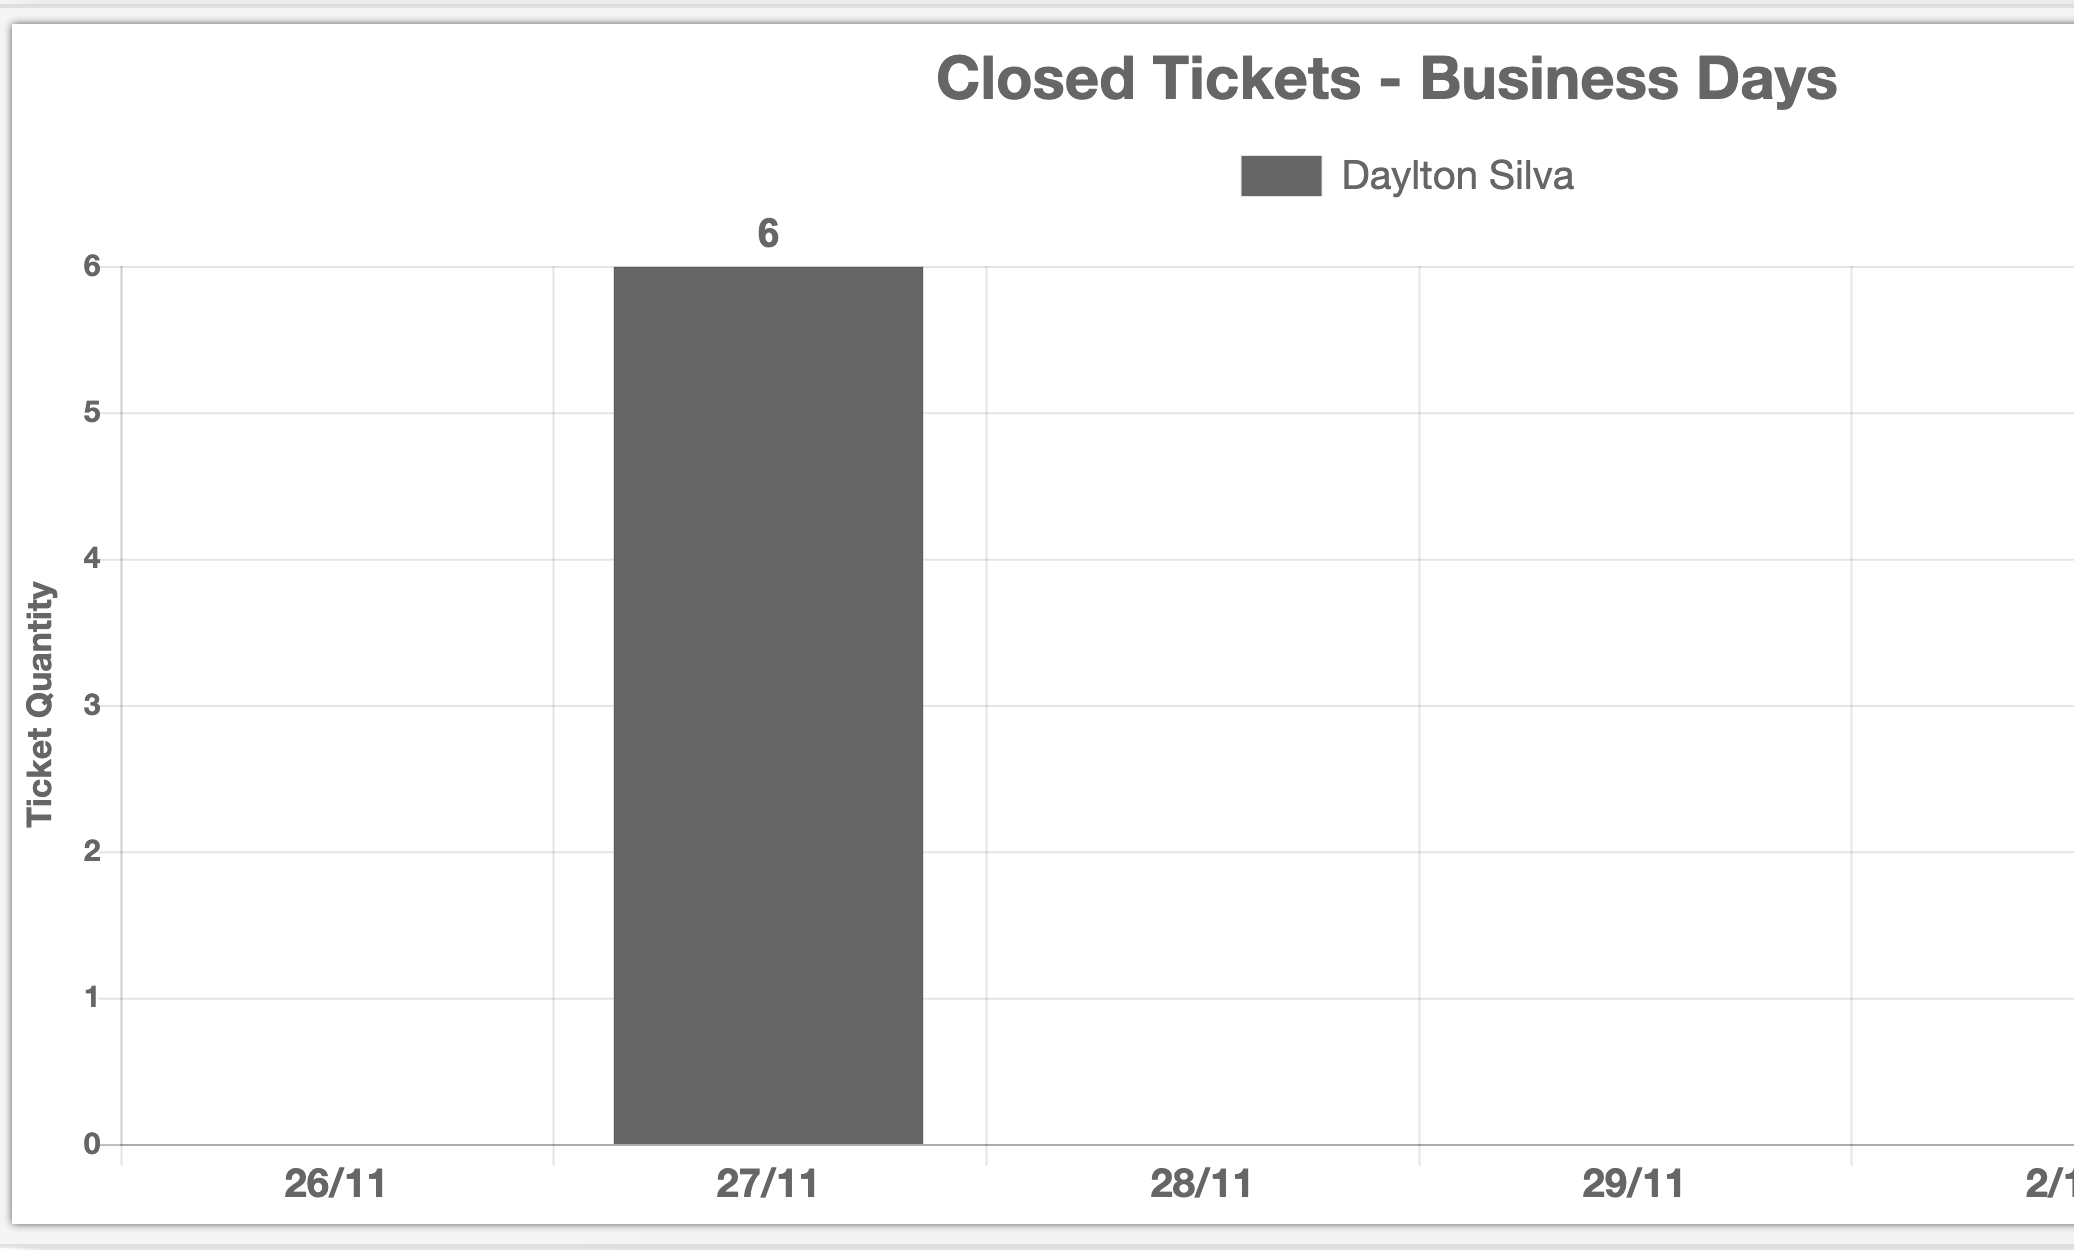
Closed Call Statistics
Provides information about the number of calls in the last 6 business days. In this chart you can also select the desired attendants.

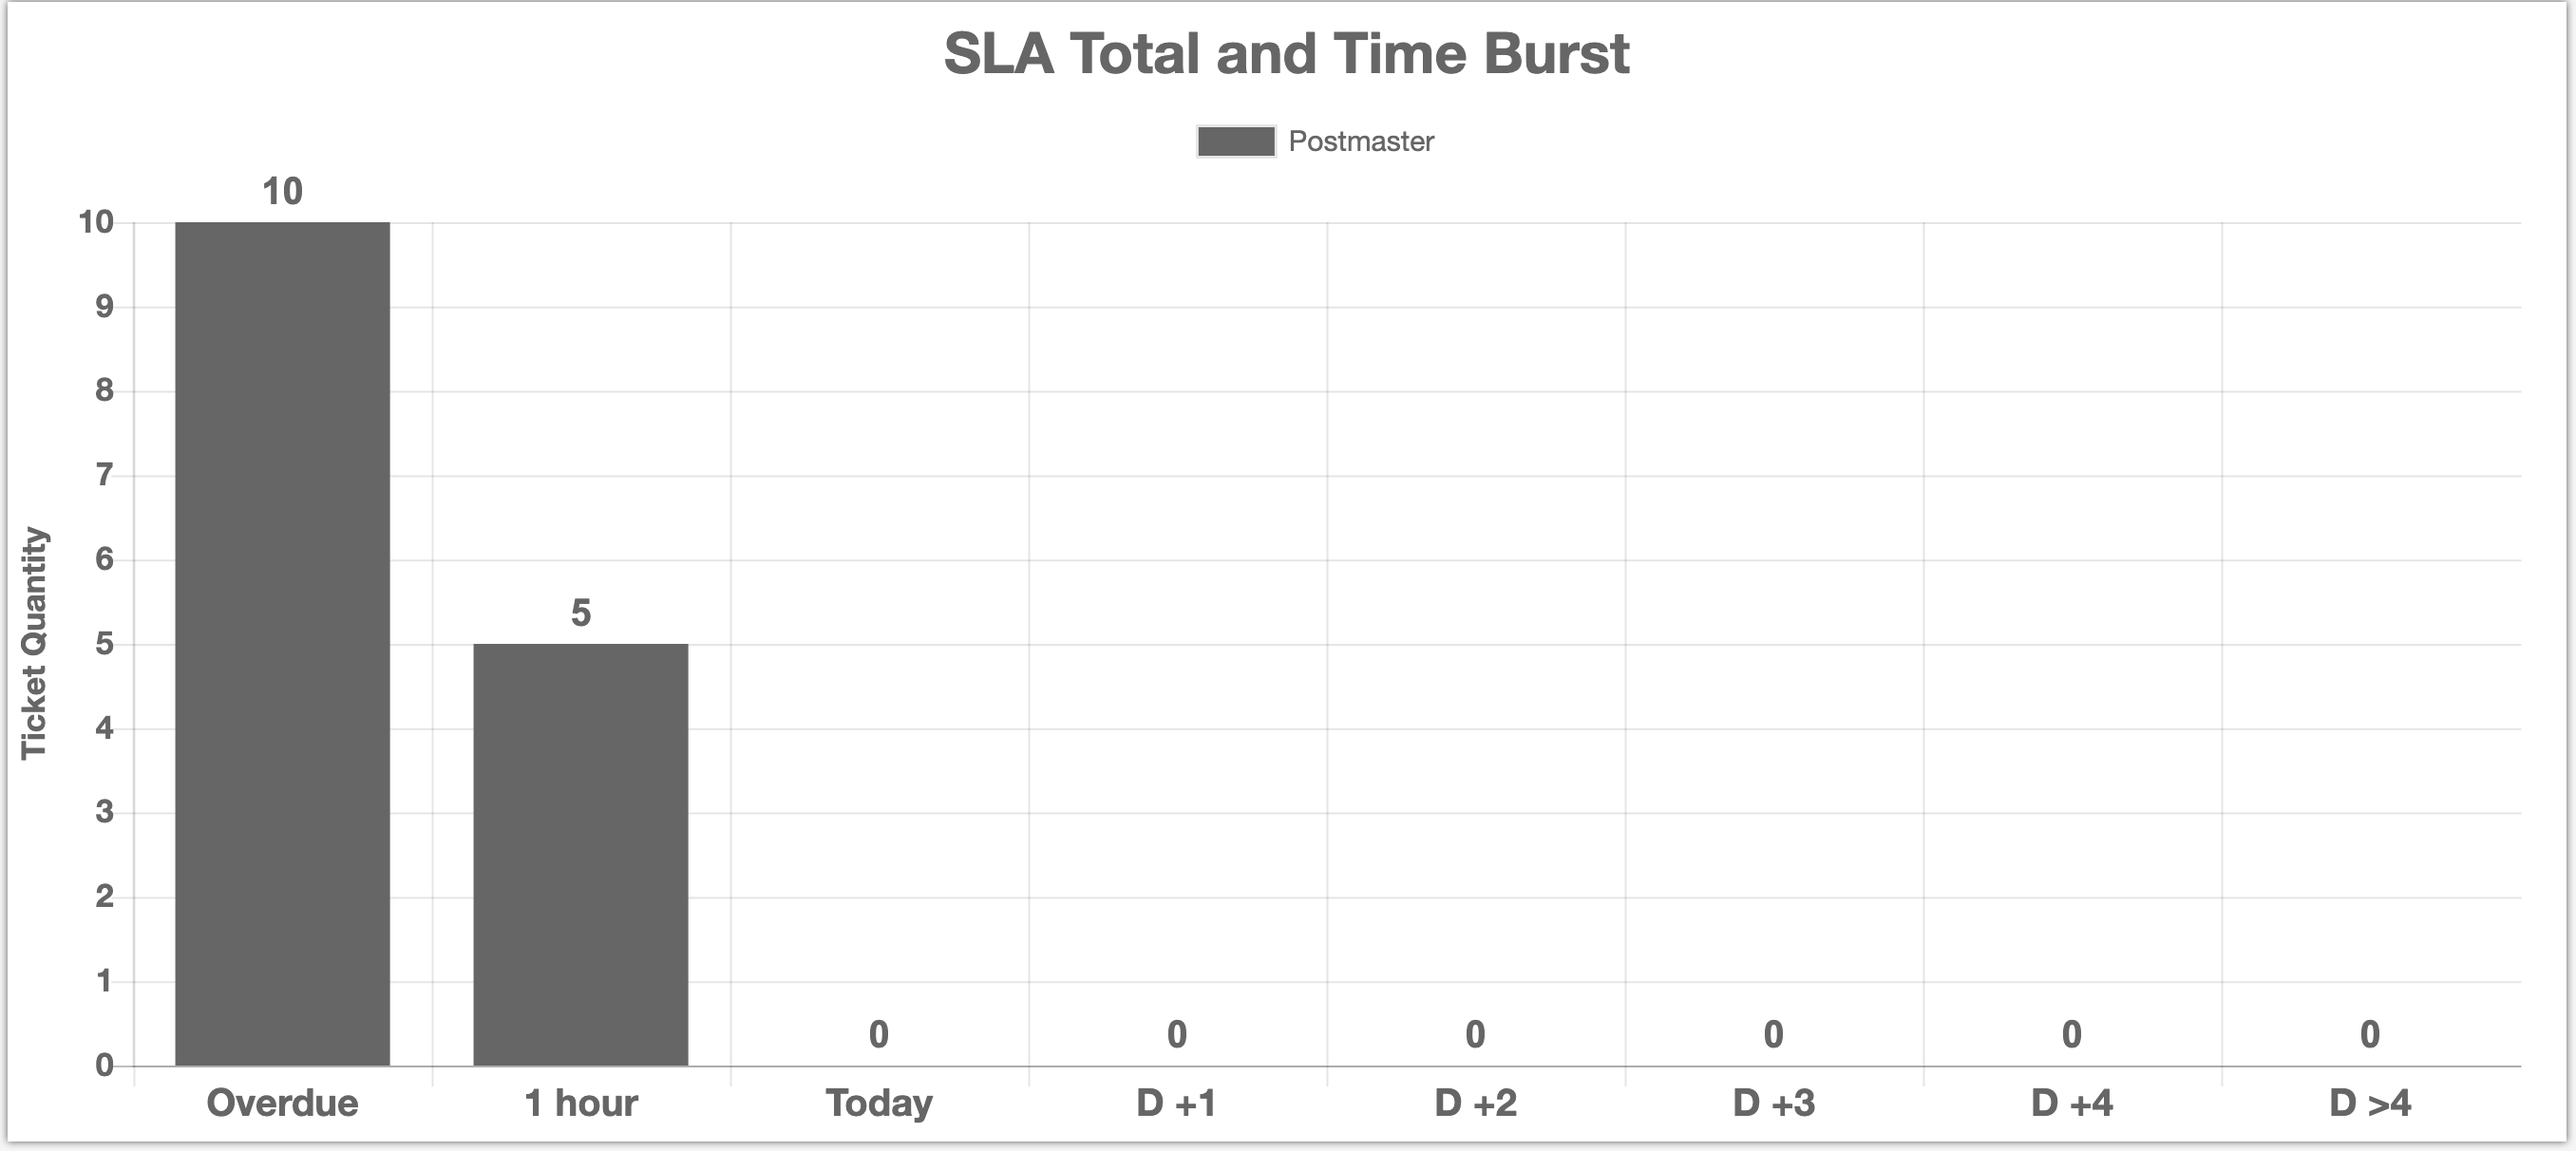
Statistics of ANSs Burst
Generates a graph that shows users the following information on your columns:
- SLA Burst (Monthly): for the Expired column.
- 1 Hour Burst: referring to column 1 Hour.
- Burst Today (24h): referring to the Today column.
- Burst in 2 days (today + 1 day): referring to column D + 1.
- Burst in 3 days (today + 2 days): referring to column D + 2.
- Burst in 4 days (today + 3 days): referring to column D + 3.
- Burst in 5 days (today + 5 days): referring to column D + 4.
- Burst 5 days or more (more than 5 days): referring to column D > 4.
In which there is a filter per queue that the user can choose one or more queues that He wants information.

This chart takes into account the lowest value (first burst) registered in the SLA.
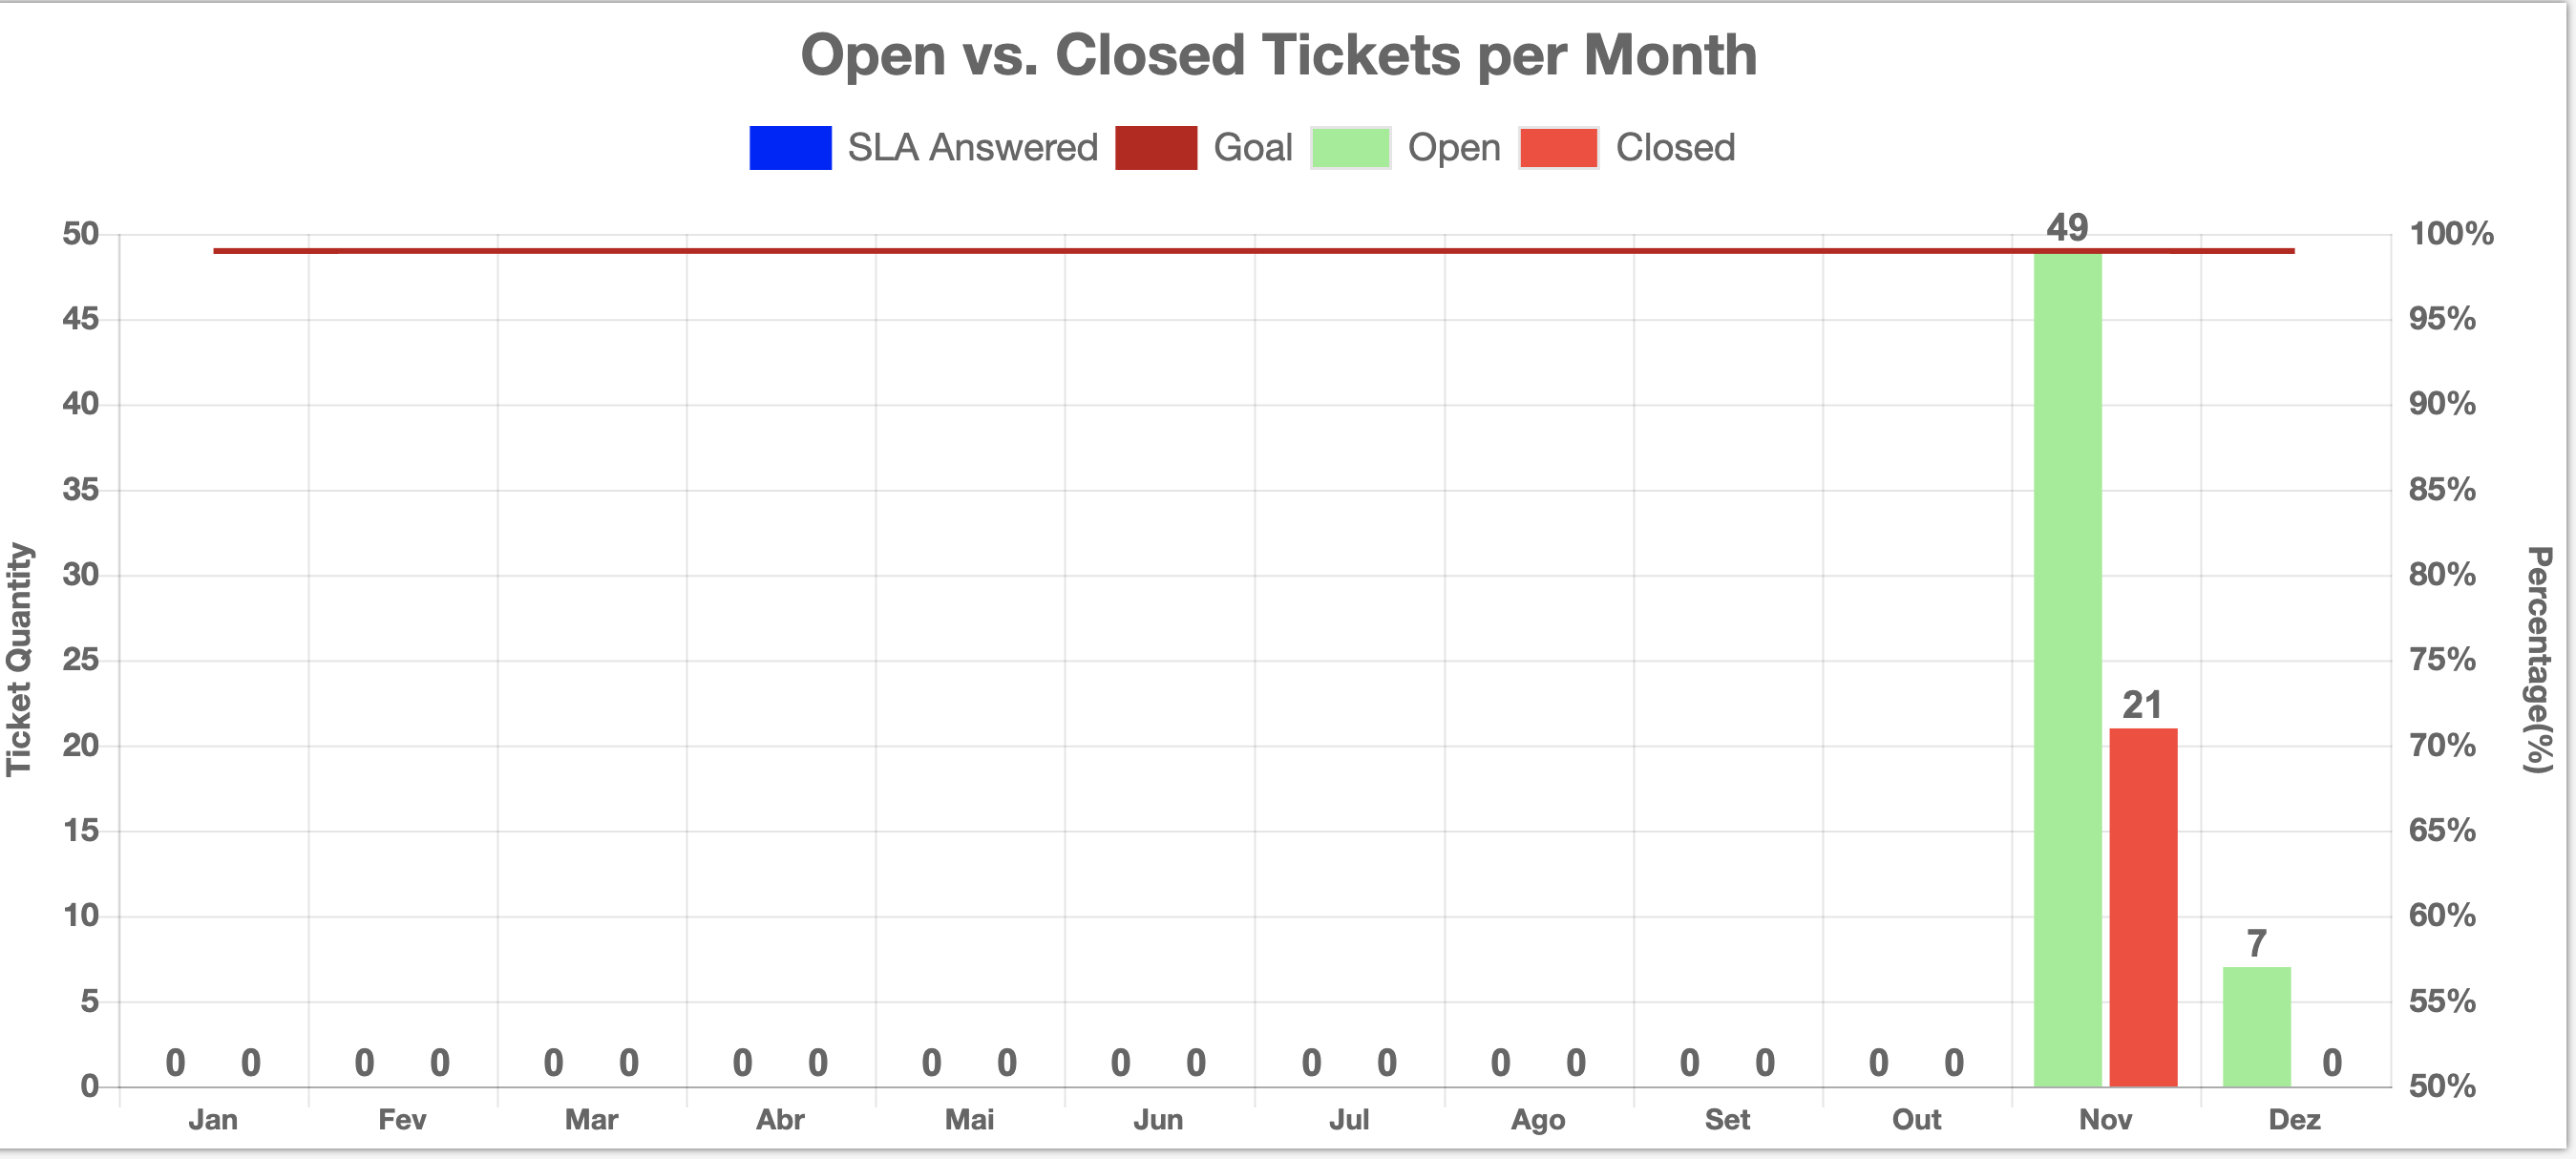
SLA Statistics and Monthly Calls
A graph is generated showing the number of open and closed calls in the month on Y-axis "A" and the percentage of ANS met on month on Y-axis "B". And they are The results from the beginning of the year to the current month are displayed. filtered by one or more rows.

Note: For the "ANS Answered" meter to appear, its count must be above the minimum percentage set by the graph (50%).